Tag Archives: programming

Matt Suntay’s jump into the PINC computing program

27 May

Matt Suntay is one of the students in the PINC program and also a research student in my lab in the E. coli / drug resistance / machine learning team. A few days ago he gave a speech at our PINC/GOLD/gSTAR graduation event. I thought it was a great speech and Matt was kind enough to let me share it here both as a video and the text for those of you who prefer reading.

“To those of you who may know me, you all know I’m pretty adventurous. For those of you who may not know me, first off, my name is Matthew Suntay, and I have jumped off planes, cliffs, and bridges – and each time was just as exhilarating as the last. But, let me tell you about my most favorite jump: the leap of faith I took for the PINC program.

I call it a leap of faith because when I first heard about the PINC program, and specifically CSC 306, I thought, “Ain’t no way this could be for me. I may be stupid because I can barely understand the English in o-chem and now I gotta understand the English in Python? Maaaan, English isn’t even my first language… But they said I don’t need any prior computer science knowledge, so why not? It’s Spring ‘21, new year, new me, right?”

And let me tell you, it definitely made me a new me. I went from printing “Hello World!” to finding genes in Salmonella to constructing machine-learning models to study Alzheimer’s Disease and antibiotic resistance in E. coli. These are some pretty big jumps–my favorite, right?–and they weren’t easy to make. However, I was never scared to make any one of those jumps because of the PINC program.

When I think PINC, I don’t only see lines of code across my screen or cameras turned off on Zoom. I see friends, colleagues, mentors, and teachers. I see a community.

I see a community willing to support me in my efforts to develop myself as a scientist. I see a community providing me the platform and opportunities to grow as a researcher. And most importantly, I see a community that shared hardships, tears, laughter, and success with me.

I can confidently say that the PINC program was, and still is, monumental to my journey through science. Thanks to the PINC program, many doors have been opened to me and one of those doors I’m always happy to walk through each time is the one in Hensill Hall, Room 406 – or the CoDE lab. It was here in this lab that I met some of the most amazing people who want to do nothing but help me reach new heights. I’m so grateful and lucky to have them. So thank you, Dr. Pennings, for believing in me and continuing to believe in me. Thank you to everyone in the CoDE lab for supporting me and laughing at my terrible jokes – and real talk, please keep doing so, I don’t know how to handle the embarrassment that comes after a bad joke.

If I haven’t said it enough already, thank you so much to the PINC program. If you were to ask the me from a year ago what his plans were for the future, he would tell you, “Slow down, dude, I don’t even know I’m trying to eat for breakfast tomorrow.” But now if you were to ask me what my plans for the future are, I’d still tell you I don’t know what I’m trying to eat for breakfast tomorrow because I’m too busy writing code to solve my most current research question, whatever it may be.

For many students, including myself, one of the biggest causes of an existential crisis is, “What am I gonna do after I graduate?” To be honest, I’m still thinking that same thought, but without the dread of an existential crisis. One of the coolest parts of the PINC program is the exposure to research and the biotechnology industry, and learning that research == me and not just != the stereotype of a scientist.

Dr. Yoon, thank you for taking the time and effort to push me and my teammates forward, because even though our projects were difficult, we learned a lot about machine-learning and ourselves, like who knew we had it in us this whole time? You definitely did and you helped us see that. Professor Kulkarni, you also helped us realize that we should give ourselves more credit. 601 and 602 showed us we can be competitive and that we’re worth so much more than we make ourselves out to be. Also, I would like to give a quick shoutout to Chris Davies and Chun-Wan Yan for the wonderful seminars because those talks gave me hope and inspiration for the future. Knowing that there’s something out there for me makes going into the future a lot less scary and a lot more exciting because who knows what awesome opportunity is waiting for me?

And one last honorable mention I would like to make is to Professor Milo Johnson. He was my CSC 306 professor, and I don’t know if he is here today, but he was an amazing teacher in more ways than one. He helped me turn my ideas into possibilities and I have him to thank for helping kick start my journey through PINC. When I thought “I couldn’t do it, this isn’t for me,” he said “Don’t worry, you got this.”

So, once again, to wrap things up, thank you to everyone who’s helped me out this far and continues to help me out. Thank you to all my friends, mentors, and teachers that I’ve met along the way. And thank you to the PINC program, the best jump I’ve ever made.

Matthew Suntay – PINC graduate 2022

SCIP 2021 helped 130 bio/chem students improve their coding skills.

26 Aug

This past June and July, 130 participants improved their coding skills in the 2021 SCIP program at SF State University! I am so excited about this program and very grateful for the amazing team of people who ran SCIP 2021 (Rochelle Reyes, Ryan Fergusson, Olivia Pham).

I would like to share with you all how it went. The 130 participants were mostly biology and biochemistry students, but we also had some alums and staff who joined. Just over half of the participants were undergrads, and most had little or no coding experience.

Our participants were ethnically diverse and 63% identified as female, non-binary or gender non-conforming.

How was SCIP 2021 organized?

The participants were organized in teams of 5-7 people. This summer, we had 10 R teams, 11 Python teams and 2 ImageJ teams. For each team, we pick one member to be the team leader. Team leaders are chosen based on their leadership experience, not their coding experience.

MaryGracy Antony, an incoming SFSU Biology Master’s student was one of the team leaders – she had no coding experience at the beginning of the summer. Here is an image from one her zoom meetings. I asked MaryGracy how it went for her and she said: “I let my team know on the first day that I, like them, have no experience with Python and we will be helping each other out throughout our time in SCIP. It definitely worked. […] As the weeks went by, people who were further in the course were helping others and even me. It was a very fulfilling experience 🙂

Each team met 4 times a week for 2 hours during 6 weeks (48 hours total). All meetings had a similar structure with time to talk and time to work quietly. The “I” in SCIP stands for immersion, which means that the learning is done during the zoom meetings. We discourage working on the materials outside of the zoom meetings, to avoid getting stuck on a coding problem with no help nearby. If the teams got stuck, they could ask questions on the Slack forum, which was monitored by the SCIP admin team.

Once a week we held a webinar for one hour, with speakers who use coding in biology, chemistry or biochemistry. This year, we hosted a teacher, a PhD student, someone who worked in the biotech industry and many others. Many of our guests were SFSU and PINC alums.

Outcomes

One of the main goals for SCIP is to allow participants to learn coding skills in a non-threatening, ungraded environment. We think we are succeeding in this for most participants, but to make sure our environment is as non-threatening as possible, we don’t test their coding knowledge and we don’t keep track of attendance. Still, there are several indicators that show that participants are learning and finding a community in SCIP. First, 97% participants would recommend SCIP to others. Second, self-reported coding confidence goes up a lot. Third, almost 90% of participants expect that coding will be part of their future career – that is huge, given that most of our participants had no prior coding experience.

New materials received very well

Participants in SCIP all learn from freely available online coding classes that we pick out for them. While these coding classes from Udacity and EdX work quite well, there are also some issues with these classes. They are not made for science students and they are mostly taught by white men. The SCIP team therefore created new materials this year.

These new materials included a series of videos about R made by Ryan Fergusson and coding projects designed by all of the SCIP admin team members (see here https://vimeo.com/showcase/8775548). More than 90% of the participants scored the new videos as a 4 or 5 (on a scale from 1 to 5) in terms of how helpful they were.  

The story behind SCIP

Last summer, in 2020, many of our bio/chem students were stuck at home, without a job or summer research experience. In the meantime, Dr Megumi Fuse, was looking for something that our research students could do during the summer, while they were funded to do research but the labs were closed. We designed a community-focused online coding program to make the most of the summer of 2020. It worked great! 160 people joined in 2020, and most of them loved it and learned new coding skills! To learn more about SCIP have a look at our website.

The people behind SCIP 2021

The most important people behind SCIP 2021 were Rochelle-Jan Reyes, Olivia Pham and Ryan Fergusson. Rochelle did most of the admin work, Olivia ran the webinar series and Ryan created videos for learning the R programming language. All three of them answered many technical questions on the Slack channel.

Funding

Funding for SCIP 2021 came from the NSF-funded Center for Cellular Construction (NSF grant DBI-1548297) and the NIH MBRS-RISE grant (#R25-GM059298). Some of the SCIP participants, especially those who had learned ImageJ spent the second half of their summer in the CCC research workshop. Many SCIP participants are now in the PINC or GOLD programs (link).

Meet Francisca Catalan, SFSU PINC alum and research associate at UCSF (spotlight)

9 Jan

FranciscaCatalan

Francisca Catalan, SFSU PINC alum and research associate at UCSF

  1. How did you get into coding? 

I took a regular CS class my second year at SF state. I thought it would be a good skill to have as an aspiring researcher and saw that it fulfilled one of my major requirements. It was a PowerPoint-heavy 8 am class three times a week. I didn’t talk to anyone else in the class and by the end of the semester I found it very difficult to show up. I passed the class but was really devastated about my experience. I thought I could never learn to program, though I never gave up completely. A couple semesters went by and I saw a friendly flier announcing PINC, SFSU’s program that promotes inclusivity in computing for biologist and other non-computer science majors. I eagerly signed up and started the “Intro to Python” class soon after. Then, with some more programming under my belt, I joined Dr. Rohlfs’ lab and began doing research in the dry lab for the remainder of my undergraduate career.

  1. What kind of work do you do now? 

I currently work at UCSF as a dry lab research associate. Our lab focuses on an aggressive form of brain cancer, glioblastoma. We try to find gene targets for new drug treatments and research the cell type of these cancerous cells in order to fight drug resistance. My main duties now include creating pipelines for our single cell, RNA-Seq, and Whole Genome Sequencing data. You can read about our lab’s latest study in our new publication on cancer discovery! DOI: 10.1158/2159-8290.

https://cancerdiscovery.aacrjournals.org/content/candisc/early/2019/09/25/2159-8290.CD-19-0329.full.pdf

  1. How did learning coding skills impact your career?

Coding has opened so many pathways for me. I was able to find a great job at UCSF soon after graduating with my Bachelor’s of Science in cell and molecular biology and minor in Computing Applications. It has also given be a giant boost of confidence! As a woman of color in STEM, I often felt underrepresented and out of place, but those feelings now quickly subside when I can help my colleagues answer coding questions! It’s motivating to feel like a necessary component of your community when often time you feel pushed out. It’s also impacted my career choices! I know now I want to be a professor in the future, I want to provide access to programming to others in hopes it will open pathways like it did for me!

  1. Do you have any advice for students who are just starting? 

Yes! Don’t give up! It can be really difficult to learn coding, but know that it’s not you, talking to a computer can just be hard sometimes! Continue practicing and ask questions, google your heart out. Take breaks when necessary, remember to breathe, and keep in mind all the amazing science you will be able to do once you have these skills under your belt!

Wu and Watterson’s Theta*?

10 Feb

If you are doing population genetics, you probably heard of Watterson’s theta.
The paper where Watterson introduced theta is a classic. It is cited more that 3000 times.

Even if Watterson (1975) was a single-author paper, Watterson wasn’t working alone on this project. In the acknowledgments he says “I thank Mrs. M. Wu for help with the numerical work, and in particular for computing Table I.” In a similar situation in 2019, she would have likely gotten co-authorship on this paper and a PhD after a few papers. We would all have known the paper as Wu and Watterson (1975).

Screenshot 2019-02-10 16.04.53

I only know this story because a group of researchers from SF State and Brown University, including my amazing friend and office neighbor Dr Rori Rohlfs, did a study on “Acknowledged Programmers.”

Professor Margaret Wu

Margaret Wu was a programmer in the 70s, at a time when programming was often a job for women. She didn’t get authorship on Watterson (1975) and other papers she worked on, but much later, she did get a PhD and became a very successful professor.

If you would like to learn more about Margaret Wu, have a look at this insightful interview: http://genestogenomes.org/margaret-wu/.

Here is a video with her about the PISA rankings for countries’ educational systems: https://www.youtube.com/watch?v=Br93GTTnWr8 .

Paper and video on acknowledged programmers in theoretical population genetics

If you’d like to read more on acknowledged programmers in theoretical population genetics, have a look at the paper by Rori Rohlfs, Emilia Huerta-Sanchez and their students Samantha Dung, Andrea López, Ezequiel Lopez-Barragan, Rochelle-Jan Reyes, Ricky Thu, Edgar Castellanos and Francisca Catalan.

Plus!!! They made a really neat video about their project:


Here is a picture with most of the authors of the Genetics paper.

2018lab_3_orig

Authors of the paper in Genetics on Acknowledged Programmers: Illuminating Women’s Hidden Contribution to Historical Theoretical Population Genetics, Dung et al 2019.


* “Wu and Watterson’s Theta” was suggested by Tim Downing in a tweet.

Scientist spotlight : Jazlyn Mooney, PhD student UCLA

25 Jan

jazlynmooney
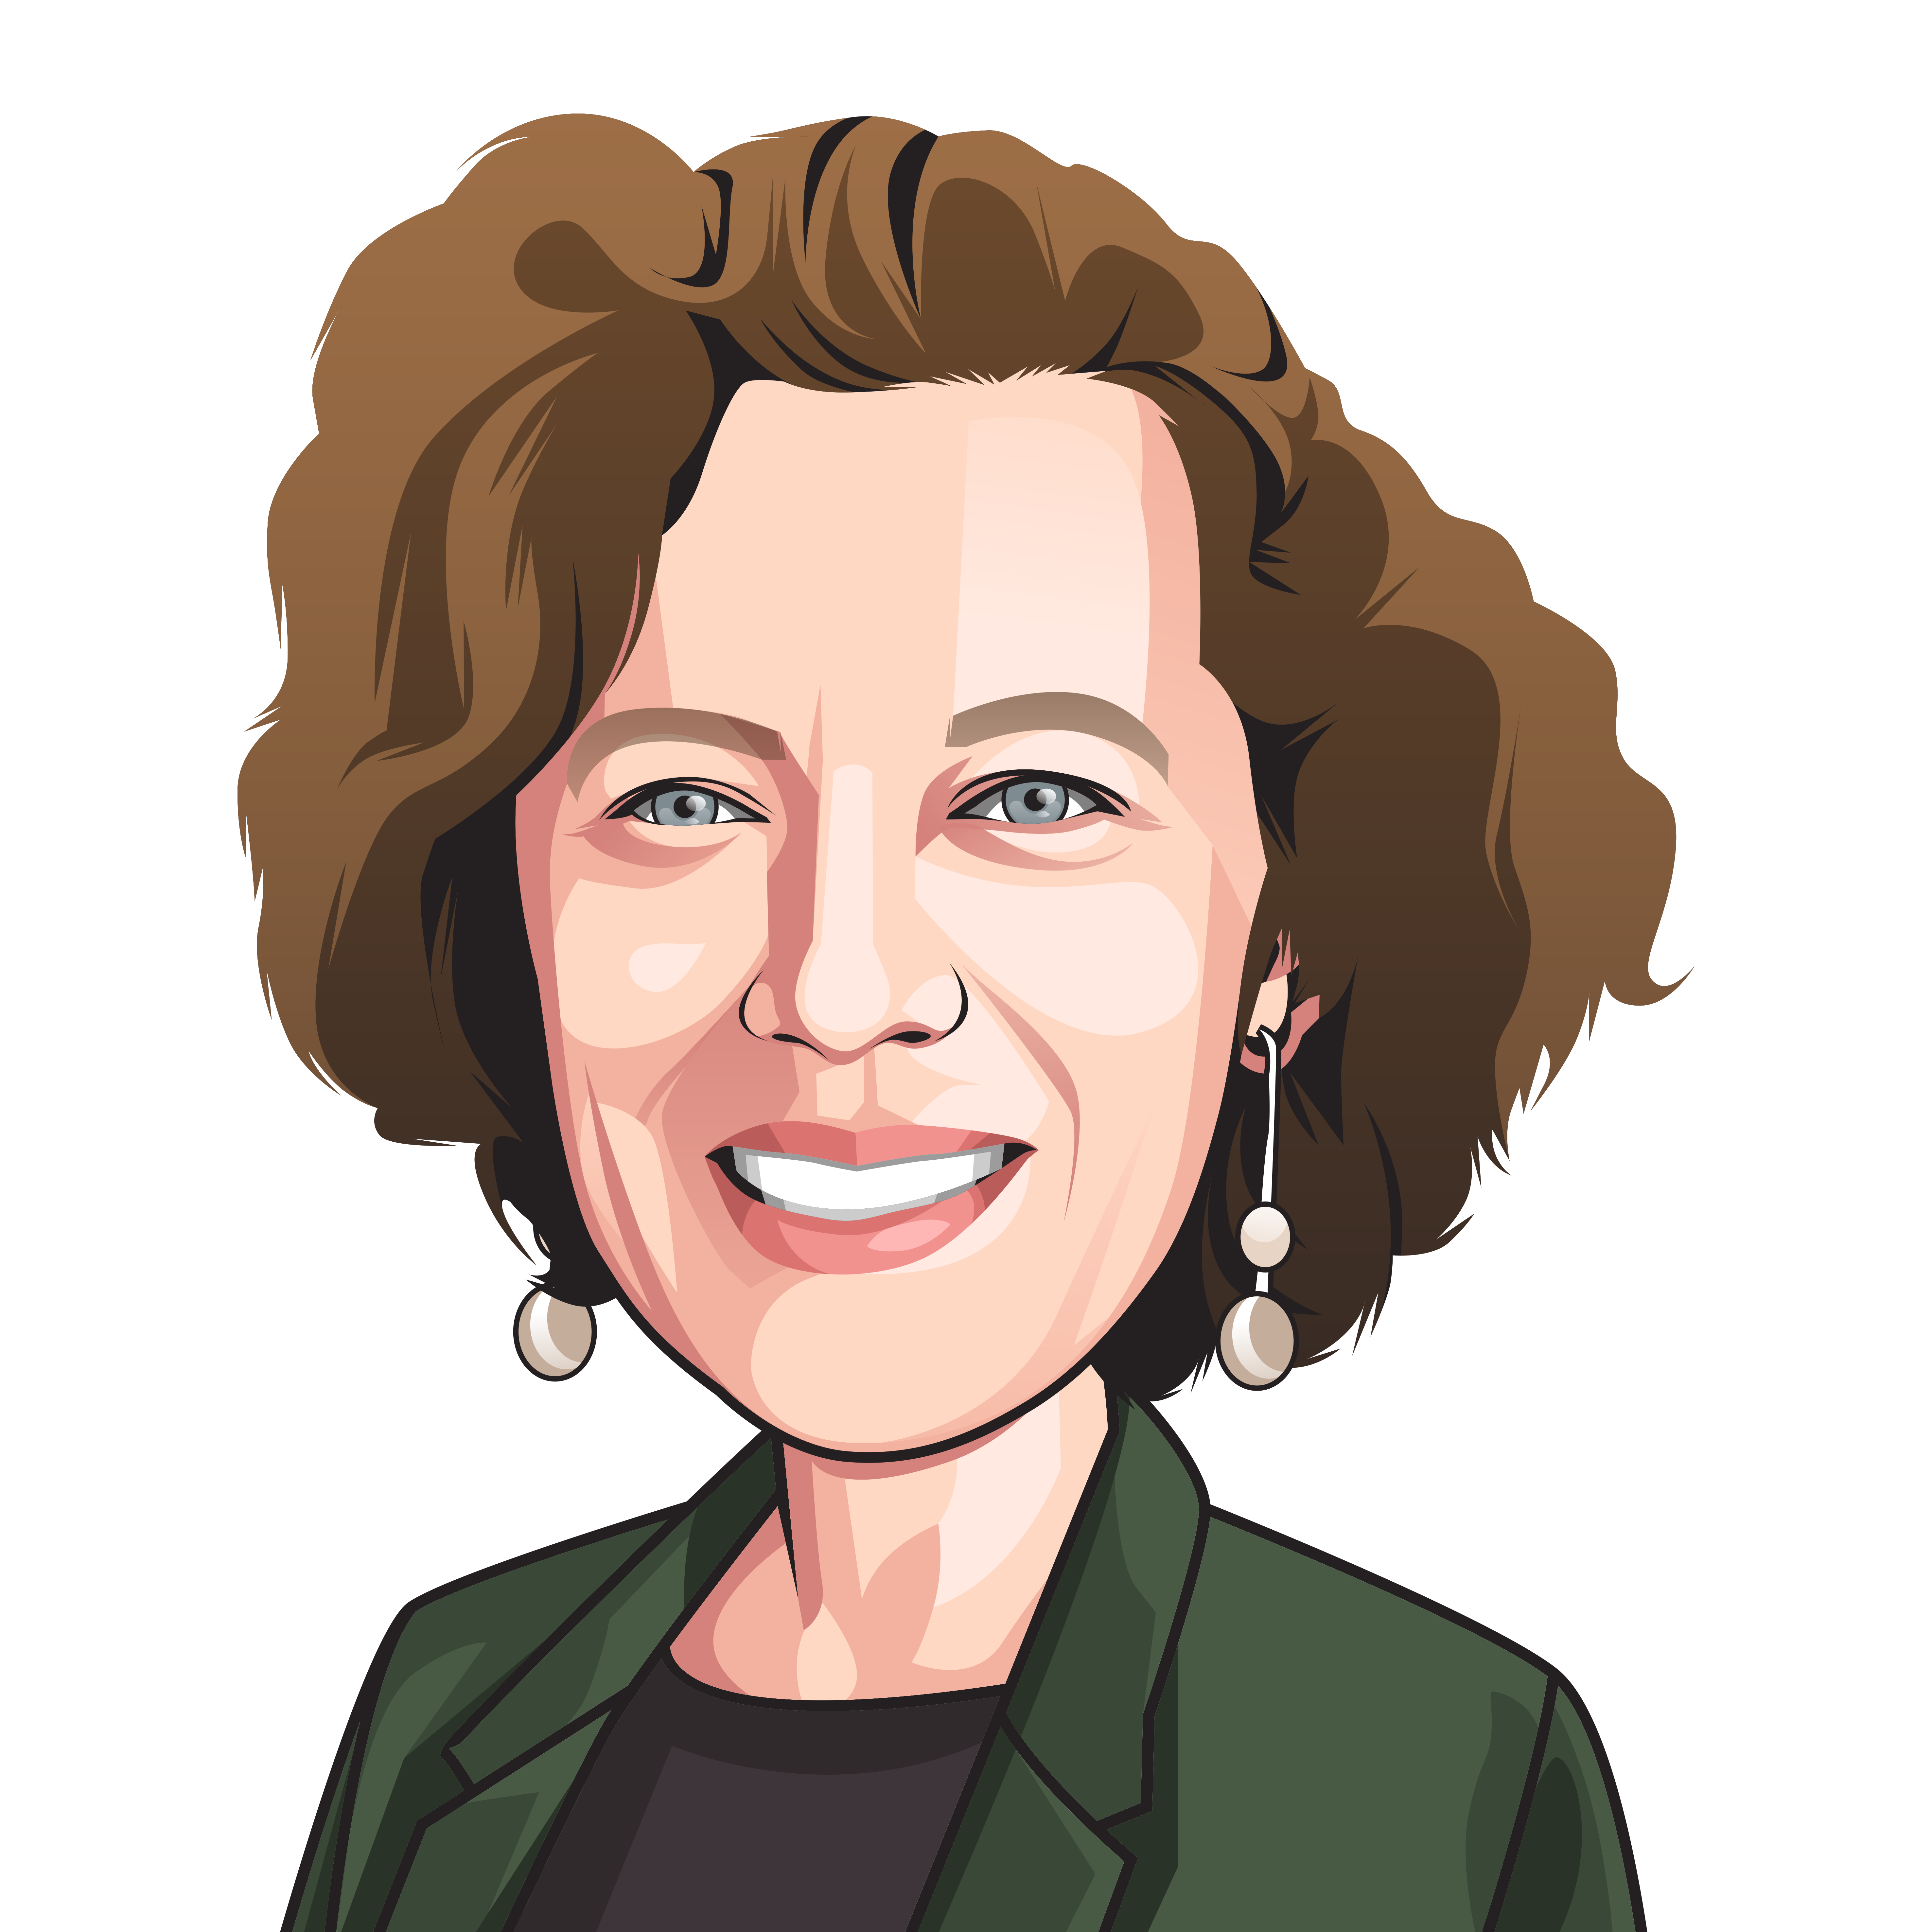
Jazlyn Mooney grew up in Albuquerque New Mexico. She went to high school and college there too (Eldorado High School and University of New Mexico).

Sketching science created a lasting interest

I became interested in science in middle school. I had a science teacher, Mr. Pecknik, who made us draw everything we learned about (from central dogma to phylogenies) for class. So we kept a sketch book for our science class and I thought it was super cool.”

Not “cut out for MD/PhD” ?

Becoming a researcher didn’t always seem possible for Jazlyn. One summer, when she was an undergrad, she participated in an MD/PhD prep program. At the end of the summer, her summer advisor told her that she wasn’t cut out to be MD or PhD! Fortunately, she didn’t listen to him but instead listened to her other undergrad advisor, her family and herself and decided to continue her path to become a scientist! She did research as an undergraduate and then applied to PhD programs.

The history of Latin American populations

Jazlyn is now a PhD student at UCLA in the lab of Dr. Kirk Lohmueller and works to better understand the history of human populations using genetic data. She recently published a paper entitled: “Understanding the Hidden Complexity of Latin American Population Isolates.” In this paper she showed how Costa Rican and Colombian people are descended mostly from European males and Amerindian females, and a small number of African individuals.

The field that uses genetic data to understand the history of populations is called “population genetics”. Jazlyn got interested in population genetics when she was an undergrad and got an opportunity to do research with Dr Jeff Long.

Learning new things and presenting at meetings

Jazlyn loves learning new things and her favorite part of being a researcher is that it allows her to learn new things and create new knowledge. Jazlyn has presented her work at many conferences including : University of Chicago Research Forum, the meeting of the American Society for Human Genetics, the Bay Area Population Genomics meeting at UC Santa Cruz in 2018.

Links

Link to paper about the history of people in Costa Rica and Colombia

Link to a free “preprint” version of the same paper

Tacos, R and Twitter

Jazlyn’s favorite coding language: R

Jazlyn’s favorite food: Tacos

Jazlyn’s Twitter handle: @Jazlyn_Mooney

The ridiculous order of the streets in the Excelsior (SF)

26 Sep

I live in the Excelsior neighborhood in San Francisco. My street is Athens Street. If I walk westwards from my home, I come to Vienna Street and then Naples, Edinburgh and Madrid. If you have any knowledge of map of Europe, you realize that the order makes no sense!

(Also, why is there Naples, but not Rome, and why Munich, but not Berlin? And why oh why, is there no Amsterdam Street? So many questions!)

Last week, I asked the students in the CoDE lab to create a map to show the ridiculous order of the streets in the Excelsior. They had fun figuring out how to make a map in R, so I thought I share their work here. Several students were involved, but my graduate student Olivia Pham did most of the work.

The code is here: http://rpubs.com/pleunipennings/212840

europe_excelsiormap

The surprising order of street names in the Excelsior neighborhood in San Francisco. We connected the cities in the order of the streets. London Street is the first city-name street if you enter the neighborhood from Mission Street, just east of London Street is Paris Street, then Lisbon Street etc. The last city-name street is Dublin Street which is closest to McLaren Park.

excelsiormap

A map of part of the Excelsior neighborhood showing the order of the city-name streets.

How to get started with R

1 Feb

Rlogo

I often get asked how to get started with learning R if there is not currently a class offered. Here is what I recommend:

1. Start with a free online Code School tutorial

First of all, check out this (free) online course: https://www.codeschool.com/courses/try-r
No need to install anything, no need to pay. Students in my bioinformatics class liked this online Code School course a lot. It will not make you a master of R, but it’s a nice starting point.

2. Install R, Rstudio and swirl on your computer

Next, it is time to install R and Rstudio on your computer. Once you have that, install the swirl package. Instructions for installing R, Rstudio and swirl can be found here: http://swirlstats.com/students.html
swirl is an R package that helps you learn R while you are in the Rstudio environment. I highly recommend using the Rstudio environment! The swirl tutorials teach you the basics of vectors, matrices, logical expressions, base graphics, apply functions and many other topics. Kind words included (“Almost! Try again. Or, type info() for more options.”)

3. Dive in with great Udacity class …

If you are ready to really dive in (and have some time to invest), try out this great Udacity class: https://www.udacity.com/course/data-analysis-with-r–ud651 (no need to pay for it, you can do the free version). This class is taught by people from the Facebook data science team. They do a great job guiding you through a lot of R coding. Importantly, they always take the time to explain why you’d want to do something before they let you do it. A large part of the course is focused on using the ggplot2 package.

… or start reading The R Book

The R Book is a book by biologist and R hero Michael Crawley. The pdf of the book is available from many websites (for example: ftp://ftp.tuebingen.mpg.de/pub/kyb/bresciani/Crawley%20-%20The%20R%20Book.pdf). Make sure you also download the example data that come with the book (http://www.bio.ic.ac.uk/research/mjcraw/therbook/).

The R Book is a great resource and very clearly written. The students in my lab enjoy reading from it and trying out the code. If you are a biologist, it’ll be fun to work with the biology examples in the R book.

4. Find others who are using R or learning R.

Learning R is hard. You will get frustrated sometimes. If you know someone who is learning with you or who could help you when you are stuck, things will be easier! If there is no one near you, try to find R minded people on Twitter or elsewhere online. Also, check out the R forum on Stack Overflow (http://stackoverflow.com/questions/tagged/r) for many questions and answers on R.

Good luck!


End of summer poster session

19 Aug

Today was the last day that the summer students were in the lab (although some of them will be back next week when the semester starts). I asked each of them to make a poster with a figure they made this summer. They are learning to program in R, and making figures is a big part of what they’ve worked on. I took snap shots of some of the students with their posters. They did a great job!

2015-08-19 14.53.47 Pedro Zorzanelli da Vitoria from Brasil

2015-08-19 14.54.31 Brendan Kusuma (SFSU, undergrad)

2015-08-19 14.55.19 Julia Pyko (SFSU post bac) and Patricia Kabeja (SFSU undergrad)


2015-08-19 14.56.02 Dasha Fedorova (SFSU undergrad) made her poster together with Sidra Tufon (not in the picture).


2015-08-19 14.56.51Dwayne Evans (SFSU Master’s student)


No programming background? No problem! Learn R

14 Jun

Guest post by Rosana Callejas

Rosana Callejas

Rosana Callejas

Can someone with no programming knowledge learn “R”? The answer is yes! My name is Rosana Callejas. I am a Physiology major, and recent graduate from San Francisco State University. I began to learn the programming language “R” at the beginning of February of this year. Despite not having any previous programming experience , I analyzed my first data set of more than 20,000 data points in only a couple of months. Would you like to learn how I did it? Stay tuned.

The power of “R”

So what exactly is “R”? It is a programming language used by many data analysts, scientists, and statisticians, to analyze data, and perform statistical analysis with graphs and figures. “R” is a great tool when analyzing large data sets. It has many additional packages that can be downloaded, which allow the user to expand or simplify commands when analyzing data.

How R coded its way into my heart

Dr. Pleuni Pennings, an evolutionary biologist, and Professor at SFSU, introduced me to this wonderful tool. “I do all my research on my computer,” Dr. Pennings said, as she showed me the open program. At first, the idea puzzled me. In all my years as a biology student, I had never met a biologist like Dr. Pennings, who has made many discoveries from analyzing HIV DNA sequences using R. She explained to me that there is an accumulation of data collected by scientists everyday waiting to be analyzed. Therefore, there is a need for scientists with the skills to interpret, and draw conclusions from such large data sets. This interested me as biologist. I imagined all the new findings that could be made if all the data collected was analyzed. It would definitely contribute to the advancement of science. With this in mind, I embarked myself in the adventure of learning R.

One command at a time

I began by taking the online course “Exploratory Data Analysis with R” on Udacity.com. The course is composed of 6 lessons, in which I first learned the basics of R, a few basic commands, followed by the analysis of one variable, and how to make simple plots. In my learning, I used R, and R studio, which can be downloaded free online. I also used data sets provided by Udacity to analyze. In addition, R comes with other data sets I practiced with. My first graphing assignment was a simple bar plot (Figure 1), that represented friend count for Facebook users of different ages. This task required the package “ggplot2”, which allows graphing.

BlogFigure1

Figure 1. Friend count as function of age.

As I learned more, I began to work with different packages, new commands, and to make better graphs. I discovered how to add color to the graphs. I learned how to order variables, make subsets, group variables, add a new columns to my data sets, work with multiple variables, run correlation tests, and much more. The following are some figures that followed that first one, and show the progress of my learning as I added more detail to that first plot throughout the course.

BlogFigure2

Figure 2. Median friend count as function of age by gender.

BlogFigure3

Figure 3. Friend count as function of age.  In the green graph each point represents 20 data points in the data set. The black line represents the mean friend count. The blue line represents with the 50th quantile. The dotted lines represent the 90th and 10th quantiles.


Figure 4. The top graph represents friend count as function of age in months, with the blue line representing the mean. The middle graph represents friend count as a function of age with blue line represents the mean. The bottom graph represents friend count vs. age in moths rounded, multiplied, and divided by 5.

Figure 4. The top graph represents friend count as function of age in months, with the blue line representing the mean. The middle graph represents friend count as a function of age with blue line represents the mean. The bottom graph represents friend count vs. age in moths rounded, multiplied, and divided by 5.

Patience is the mother of all virtues

Learning R was definitely a challenge. Commands that in theory should work, sometimes did not work. As a new user, it was difficult to know exactly what had gone wrong. Fortunately, I had the guidance of Dr. Pennings who helped me through the process. I also looked for resources outside of Udacity. One great package to use along with R is “swirl,” which is a teaching package. With swirl, I learned commands not taught in the Udacity course. It has multiple lessons that give the user immediate feedback. Patience and persistence are key to learning R. Now I have seen what R can do, I know it was worth learning.

The possibilities are endless

My favorite feature of R is that the code used in a previous analysis can be saved, and reused. R users can also share pieces of code with one another, which helps expand the knowledge among users. If changes need to be made in the middle of analysis, this is rather simple, and there is no need to reanalyze the data. R can be used to study many different types of data of any size or background. Scientists such a Dr. Pennings make major findings in Biology using R.

Although new to R, I was able to begin the analysis of my own data set [1] within only a few months of learning about it. Below is a figure which resulted from the question: Which HIV regimens are most common and in what years? In order to answer this question, many hours of work were invested in preparing the data set, excluding undesired data points, sub setting, color coding, etc., ending up with 6255 HIV data points, which included only the 26 most common unique regimens as a function of time. The graph represents the most common regimens of HIV treatments taken by patients in different years. It is also organized in order of increasing number of drugs per regimen. Each regimen was color coded to include a NNRTI drug, a PI drug, or consist of nRTIs.

Figure 5. The graph represents the most common regimens of HIV treatments taken by patients in different years belonging either to NNRTI, nRTI, or PI.

Figure 5. The graph represents the most common regimens of HIV treatments taken by patients in different years belonging either to NNRTI, nRTI, or PI.

As the graph shows in 1989, and early 1990s, the HIV treatment consisted of the single drug AZT, and later in 1997, NVP. As the years progressed, regimens composed of two drugs became more common. It isn’t until 1996 that we begin to see regimens composed of three drugs. Regimens composed of three drugs are the most abundant and continue to be taken by patients up to 2013, while the single drug treatments seemed to have ceased in 2008. In 2002, we first observe regimens composed of four drugs (although RTV is often not counted as a drug, so these regimens may be considered 3-drug regimens as well), which also continue to be used along with the three drugs regimens.

R is a great program for data analysis. I believe that anyone who would like to learn it, with persistence can definitely do it. I will continue learning R, and analyzing my data set. I hope to use it as a useful tool for future investigations in my career.

[1] Thanks to Dr Robert Shafer from Stanford University for sharing the data with us!

Being a better programmer: learning Python with Udacity.

16 Oct

When I started my “Being a better scientist” project, after reading Gretchen Rubin’s Happiness project, I decided to start with a one month focus on “Being a better programmer”. I made three resolutions.

1. Learn python by finishing Udacity‘s python course.
2. Look it up, write it down.
3. Annotate, annotate, annotate.

Like many biologists, I am a self-taught programmer. I use C++ and R, but for a long time I have wanted to learn a new language. One that is easier than C++ and faster & more suited to my needs than R. I love using R, so I think the new language will not replace R, but I think it could be useful for some of my projects. Plus, I think that by doing a programming course, I will learn stuff that could be useful for working in any language.

A few months ago I already started a python class at the online university Udacity. Even though I enjoyed the course a lot, I got stuck after 3 units (out of 7). This month, I will finish this course. Today, I just finished unit 4. In the next three weeks I will do units 5, 6 and 7.

What I like about the Udacity CS101 course:
1. The course is entirely web based and is VERY interactive. There are tons of little quizzes and programming exercises.
2. In the programming exercises, you can check the answers by executing the code and running some tests, and then have it checked by Udacity. If my code is almost correct, the response may be something like: “Try again, your code didn’t pass the following test …” – which is very useful and motivates me to, indeed, try again.
3. The lecture parts are short (2-7 minutes) which is good. The lectures are also interesting and teach some computer science theory.
4. It is free. I know I should be willing to pay for a useful course, but honestly, I don’t think I would have started it if it wasn’t for free.

What I don’t like about the Udacity CS101 course:
1. Before I started, I had no idea how long it would take to do the course. It is split in 7 units, but I didn’t know if a unit corresponds to an hour of work, a week of work or a semester of work. Turns out it is about 10 hours for me (rough guess).
2. The course lets you build a web crawler and by doing that, you learn all the python you need for the task. Although I think it is good that they focus on a specific task, I am not interested in web crawlers, and I would prefer to build something related to biology. How about some alignment software?
3. The time it takes to execute code (on the Udacity servers) is somewhat long which is slightly annoying.
4. Very few of the Udacity teachers are women. Maybe that’s why the fun examples are about cars and superheroes.